Low vaccination rates and high personal exemption percentages in schools may contribute to increasing the odds of a measles outbreak
Amanda L. Skarlupka
Report written for Fall 2020 BIOS7500
Abstract
Decreasing vaccination rates among school aged children are leading to an increasing incidence of the vaccine preventable childhood disease, measles. Decreasing vaccination and increasing personal exemptions may contribute to increasing the odds of measles outbreak. Medical exemptions were not found to potentially contribute. Limiting personal exemptions may decrease measles outbreaks.
Introduction
Measles is highly contagious and transmitted from coughing and sneezing and direct contact with infected individuals. Symptoms include fever, cough, runny nose and a characteristic rash. Non-immunized individuals have a 90% chance of contracting the disease when exposed [1]. The live-attenuated measles vaccine should be administered in two doses at 12 months and right before entering kindergarten, and is in combination with mumps and rubella as MMR [2]. The immunity is defined to be lifelong. The vaccine is considered safe, causing mild adverse reactions such as fever in 5-15% of the individuals, and a rash lasting 1-3 days in roughly 5% of the individuals [2].
Vaccine hesitancy and antivaccination movements contribute to decreased vaccination in schools and have been declared by the World Health Organization as threats to global health. This anti-vaccination movement is often spread and escalated through misinformation and social media [3]. Previously it has been determined that MMR vaccination reduces the incidence rate for that population [4]. But the overall vaccination rate in schools has decreasing since 2000 and the number of cases increasing up to 1282 cases in 2019 [5]. Therefore, it is important to maintain high proportions of vaccinated populations to limit disease transmission.
With the increasing percentages of school age children not being vaccinated due to medical and personal reasons. I aimed to understand how these increasing exemptions and decreasing vaccination rates effected the odds of a measles outbreak.
Materials and Methods
The data used for this study were gathered from two different sources. The vaccination were from the Wall Street Journal publication [6], available at https://github.com/WSJ/measles-data. The vaccination data covers the 2017-2018 school year for eleven states, and the other twenty-two states’ data are for 2018-2019. Rates and percentages were assumed to be similar from year to year. The school’s name, state, county, district, type, enrollment, MMR and overall vaccination rate, and separate percentages of students exempted from vaccination for medical, personal and religious reasons.
The United States case information was from the supplementary excel file from the Gardner (2020) article [7]. The case data is from the cases reported in the United States from during the year 2019. Data was initially gathered and collated from numerous sources including news reports, and state public health databases. All data was analyzed using R version 4.0.2 and RStudio [8].
Data from the continental United States was used for analysis. Variables that were incomplete or unnecessary were removed, including religious exemption, enrollment data, type, district, name, and index. County level rates and percentages were averages. Number of cases were shown in graphs as log base 10 transformed values. Statistical significance was defined as a p-value < 0.05.
Results
The cases from 2019 were not localized to a single state (Fig 1A). The number of cases ranged across the United States with the highest number of measles cases being in New York State (1072 cases). However, when looking at the data on a higher resolution (county level) it became clear that the cases were not evenly dispersed throughout a state (Fig 1B). Therefore, the data was analyzed at the county level to limit invalid state-level assumptions. For example, within New York state, the cases were centered around New York City. Washington and Oregon also had a high case count across the counties bordering the western coast.
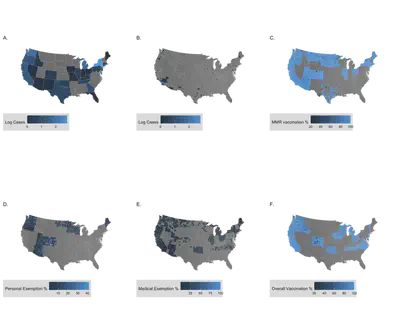
The vaccination data was not available for all states. However, when looking at the vaccination data for measles, mumps, and rubella (MMR) vaccination specifically (Fig 1C), the percentage was consistently high across the available regions with an estimated mean value of 94.32% (n = 28,324 counties, 95% confidence interval (CI): 94.22%, 94.43%). The personal exemption percentages of the entire country had a mean of 6.93% (n = 6411 counties, 95% CI: 6.73%, 7.13%) (Fig 1D). The medical exemption percentages had a mean of 3.10% (n = 12,972 counties, 95% CI: 3.03%, 3.18%) (Fig 1E). The overall vaccination percent for the country was lower than that of the MMR vaccination coverage at a mean value of 92.0% (n = 26,243 counties, 95% CI: 91.88%, 92.13%) (Fig 1F).
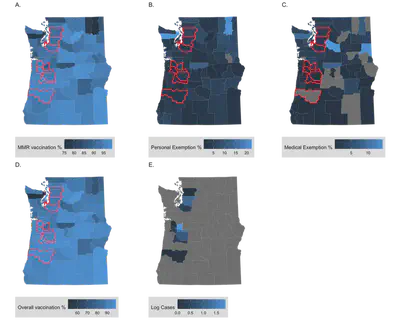
After separating the vaccination data based on county, the most informative states that also had a high measles case load were Washington and Oregon. These two states were selected for further analysis to determine if there was any relation between vaccination rates and exemption percentages and case number. Figure 2 presents the exemption, vaccination, and cases for both Washington and Oregon.
Odds ratios were determined using factored continuous variables. The factor levels cutoffs were determined by the quantiles of the northwestern county data. After which the odds ratios were determined for the four quantiles compared to an outcome of presence of a cases. Each exposure was done separately (Table 1).
Table 1: Odds ratio of Northwestern counties’ vaccination and exemption percentages and the odds of having a measles case.
| COVERAGE | ODDS RATIO | P-VALUE |
|---|---|---|
| OVERALL VACCINATION | ||
| 93-98% | Ref | |
| 89-93% | 5.36 | 0.113 |
| 83-89% | 2.55 | 0.440 |
| 53-83% | 0.89 | 0.944 |
| MMR VACCINATION | ||
| 95-100% | Ref | |
| 92-95% | 5.25 | 0.133 |
| 89-92% | 3.23 | 0.327 |
| 71-89% | 1.76 | 0.673 |
| PERSONAL EXEMPTION | ||
| 0.75-3% | Ref | |
| 3-5.4% | 6.02 | 0.086 |
| 5.4-7.1% | 3.45 | 0.300 |
| 7.1-29.2% | 1.00 | 1.00 |
| MEDICAL EXEMPTION | ||
| 0-0.5% | Ref | |
| 0.5 – 2.0% | 0.64 | 0.665 |
| 2-13.7% | 0.59 | 0.555 |
The highest overall vaccination coverage of 93-98% was used as the reference. The 89-93% overall coverage had 5.36 times higher odds of have a case, and the 83-89% had a 2.55 times higher odds of a case compared to the reference. The lowest vaccination coverage 53-83% had 0.89 time the odds of having a case. With a p-value of 0.113, the 89-93% overall vaccination coverage warrants further analysis. The highest MMR vaccination coverage of 95-100% was used as the reference. The 92-95% MMR coverage had 5.25 times higher odds of have a case, and the 89-92% had 3.23 times higher odds of a case compared to the reference. The lowest MMR vaccination coverage, 71-89%, had 1.76 times the odds of case.
For personal exemptions, the lowest percentage was used as the reference, 0.75-3%. The 3-5.4% percentage had an odds ratio of 6.02, and the 5.4-7.1% had an odds ratio of 3.45. The highest exposure, 7.1-29.2% had an odds ratio of 1.00. The p-values were not significant. However, the 3-5.4% group had the lowest p-value of the odds ratio of 0.086. This relationship along with the previous case of overall vaccination coverage should be investigated further. The medical exemption category 0-0.5% was used as the reference. The 0.5-2.0% group had an odds ratio of 0.64 and the 2-13.7% group had a ratio of 0.59, with non-significant p-values.
## Discussion
No odds ratio was significantly different compared to the reference group. However, some of the groups were close to significant. The 3-5.4% compared to 0.75-3% personal exemption group had an odds ratio of 6.02 with a p-value of 0.086. Although this was not significant this indicates something further to look into. With only 73 cases in the two states and by creating four different factors the data may not be factored adequately. When comparing medical exemptions, there was no factor that was close to being significant. Thus medical exemptions may not contribute to the odds of a measles outbreak as much as personal exemptions.
Further analysis could include an additional analysis of the specific outbreak. Data including school enrollment numbers, population size, religious exemptions and population religion, may prove useful in future comparisons. Religious data would be insightful especially due to the 2018 outbreak in New York occurring in populations where vaccination is against religious belief [9, 10].
In conclusion, this research indicates that decreased vaccination coverage and increased personal exemptions may contribute to increased measles cases, but it does not implicate medical exemptions as a factor.
References
- CDC, Measles, in Epidemiology and Prevention of Vaccine-Preventable Diseases, J. Hamborsky, A. Kroger, and S. Wolfe, Editors. 2015, Public Health Foundation: Washington D.C. p. 22.
- Rota, P.A., et al., Measles. Nat Rev Dis Primers, 2016. 2: p. 16049.
- Dhaliwal, D. and C. Mannion, Antivaccine Messages on Facebook: Preliminary Audit. JMIR Public Health Surveill, 2020. 6(4): p. e18878.
- Geier, D.A., J.K. Kern, and M.R. Geier, Childhood MMR vaccination and the incidence rate of measles infection: a ten year longitudinal cohort study of American children born in the 1990s. BMC Pediatr, 2019. 19(1): p. 325.
- Sinclair, D.R., et al., Forecasted Size of Measles Outbreaks Associated With Vaccination Exemptions for Schoolchildren. JAMA NetwOpen, 2019. 2(8): p. e199768.
- Moriarty, D., T. Umlauf, and B. Abbot, What’s the Measles Vaccination Rate at Your Child’s School?, in The Wall Street Journal. 2019.
- Gardner, L., et al., Persistence of US measles risk due to vaccine hesitancy and outbreaks abroad. The Lancet Infectious Diseases, 2020. 20(10): p. 1114-1115.
- RStudio-Team, RStudio: Integrated Development for R. 2020, RStudio, PBC: Boston, MA.
- Kennedy, A.M. and D.A. Gust, Measles outbreak associated with a church congregation: a study of immunization attitudes of congregation members. Public Health Rep, 2008. 123(2): p. 126-34. 10. Knol, M., et al., Large ongoing measles outbreak in a religious community in the Netherlands since May 2013. Euro Surveill, 2013. 18(36): p. pii=20580.